
What Is a Chart of Accounts? (And How to Structure One)
The chart of accounts is the filing system for every shilling your business touches. Get its structure right and every report writes itself; get it wrong and you spend years fighting numbers that never quite answer the question.
Every accounting system, however sophisticated, rests on one deceptively simple structure: the chart of accounts. It is the complete list of the categories — accounts — into which every transaction the business records is sorted. Cash, sales, rent, salaries, stock, loans: each is an account, and each transaction lands in one. The chart of accounts is, in other words, the filing system for your money, and like any filing system its usefulness is decided entirely by how well it is organized. A good one makes every report a matter of retrieval; a bad one turns every question into a forensic exercise.
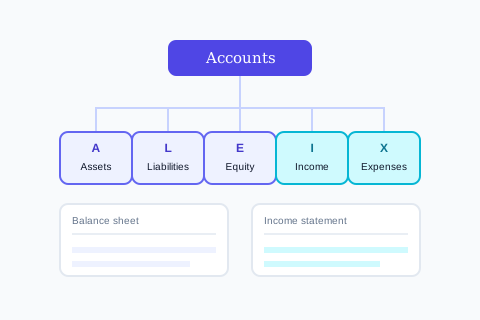
The five account types
Every account belongs to one of five fundamental types, and these map directly onto your two core financial statements — the balance sheet and the income statement:
| Type | What it holds | Statement |
|---|---|---|
| Assets | What you own — cash, stock, equipment, receivables | Balance sheet |
| Liabilities | What you owe — loans, payables, tax due | Balance sheet |
| Equity | The owners' stake — capital and retained earnings | Balance sheet |
| Income | What you earn — sales, fees, other revenue | Income statement |
| Expenses | What it costs to operate — salaries, rent, supplies | Income statement |
Assets, liabilities, and equity describe what the business is at a moment in time; income and expenses describe what it did over a period. Every account you create slots into one of these five, and that classification is what lets the system assemble a balance sheet and a profit-and-loss automatically from the same underlying transactions.
Structure is where it lives or dies
The art of a chart of accounts is granularity — how finely to divide things. Too coarse (one giant "expenses" account) and you can never see where money goes. Too fine (a separate account for every conceivable cost) and data entry becomes guesswork and reports become noise. The discipline is to create accounts at the level you actually make decisions: if you will never act on the distinction between two costs, they do not need separate accounts. Most well-run SMEs land on a few dozen to a couple of hundred accounts, structured so related items group together and sub-total cleanly.
Design for the report you want to read
The trick that saves years of pain: start from the reports and questions you want to answer — "what did each branch cost?", "how much do we spend on transport?" — and design the chart of accounts backwards from there. A chart built to produce the reports you need is worth ten built by copying a generic template you will spend forever adjusting.
Dimensions: the modern alternative to endless accounts
Older systems forced everything into the account code, so tracking cost by branch and by department and by project meant multiplying accounts endlessly. Modern systems separate the account (what kind of cost) from dimensions (which branch, project, or department incurred it), so a single "transport" account can be sliced any way you need without creating a transport account per branch. This keeps the chart clean while making the reporting far richer — and it is why a well-designed system rarely needs the sprawling account lists that plagued older bookkeeping.
The chart of accounts underpins everything else in your books. It is what a trial balance summarizes, what determines whether your accrual accounting can show receivables and payables cleanly, and what decides whether month-end is a report you run or a puzzle you solve. Time spent structuring it well at the outset is the highest-return hour in the whole of setting up your finances.
What AWRA OpsHub does today
- Accounts with a name, a type (debit or credit) and a system key that maps them into statement groups defined in configuration.
- Double-entry generated automatically for stock adjustments, POS sales and payments, so paired entries are created by the system rather than typed.
- A live trial balance assembled from those entries.
- Project as a real dimension elsewhere — a project is a native field on purchase orders, expenses, invoices and tasks, so project reporting exists outside the chart of accounts.
- An account classification on every account, which is what places it on the income statement or the balance sheet.
- Manual journal entries — a general journal for an accountant to post an accrual, a correction or an opening balance, balanced before it saves and refused in a closed month.
- Equity accounts — share capital and the like — added and posted to by manual journal, with retained earnings carried on the same basis as the income statement, so the balance sheet is complete.
More we can add to your workspace
- Account codes and numbers, with a parent-child hierarchy. Accounts carry a name and a classification today, so a numbered chart in the conventional sense is the build.
- Dimensions on every ledger entry. A journal entry already carries a department, branch and project: till sales post with their branch, payroll with its department, and supplier bills and expense claims with whichever they name, and the income statement breaks down by any of the three. Tagging the remaining flows, and slicing the trial balance the same way, is being built.
This is a real architectural boundary rather than a backlog item, and the reason is worth stating: we are an operations system that keeps a consistent internal ledger, not a statutory accounting package. If you need a numbered chart and a statutory set of books, that belongs in your accounting software — and the honest design is to run both with a clean handoff rather than to pretend one replaces the other. The same argument, in more detail, is in where the line falls between operations and statutory accounting.
Anything above that you need, we can build for you
Everything listed above as something we can add describes what ships in the standard product today — it is a starting point, not a limit on what AWRA OpsHub can do for your organisation. Kenya's eTIMS integration and its maintained payroll engine are both in the product because clients needed them and commissioned them; neither appeared by itself, and the same door is open for whatever you just read about. One qualification so this is worth what it claims: a small number of things on this blog we deliberately leave to a specialist rather than build — a statutory ledger we will not sign our name to, a rule that would decide a tax question for you, a clinical or member-funds record that belongs in a regulated system — and where that is true the post says so in those words. Everything else is a scope, a timeline and a price.
The operational work, which is what most commissions actually are
An extra approval stage in a chain that does not match the standard one, a custom field set on employees or assets that only your sector needs, an expiry that has to block an order rather than send an email, a report your board asks for in a shape nothing produces, or a scanner or weighbridge feeding the goods-in door. These are the commissions we are asked for most often and the smallest ones we quote — and unlike a revenue-authority pipeline, none of them waits on a regulator.
The module-shaped additions, which are the ones readers ask for most often
A price list with real discount authority, a customer-facing quotation that expires, a bill of materials or recipe costing, a staff advance that is issued, acquitted and chased, a member or unit ledger, a matching rule that holds a payment. Each of these is a build rather than a setting, and each has been quoted before — a bigger piece of work than a custom field, with a written spec and a date instead of a roadmap slide.
The report, document or pack nothing currently produces
The board pack in the shape your board actually asks for, a donor or funder layout, an invoice or receipt template carrying what your regulator or your customer expects, a dataset the report builder cannot reach yet. Usually the fastest thing on this list to deliver, because the data is already in the system.
Systems, rails and hardware you already run
The accounting package, CRM, online store, core banking or custom database you intend to keep — connected through our API so a fact is entered once and appears everywhere it is needed. Plus the physical edge: a scanner, a scale, a weighbridge or a till peripheral feeding the door it belongs to.
How it works: you describe the requirement, we return a written scope, timeline and cost, and once agreed it is built into your environment and maintained as part of the product. Nothing here waits on a regulator or a published specification, which is why operational builds are the ones we quote fastest. Tell us the requirement that would otherwise rule us out — that is a better first conversation than a demo.
Tell us what your operation needsOperations data your accountant can use
A consistent internal ledger, a live trial balance, and project coding on the transactions that matter — feeding the accounting package that owns your statutory books.
Explore accountingFrequently asked questions
What is a chart of accounts?
It is the complete, organized list of every category — account — into which a business sorts its financial transactions, such as cash, sales, rent, and salaries. Every transaction is filed into one account, and the structure of that list determines how easily the system can produce reports like the balance sheet and profit-and-loss.
What are the five types of accounts?
Assets (what you own), liabilities (what you owe), equity (the owners' stake), income (what you earn), and expenses (what it costs to operate). The first three form the balance sheet and the last two form the income statement, all assembled from the same underlying transactions.
How detailed should a chart of accounts be?
Detailed enough to answer the questions you actually make decisions on, and no more. Too few accounts hide where money goes; too many make data entry guesswork and reports noisy. Design it backwards from the reports you want to read, and use dimensions (branch, project, department) rather than multiplying accounts to track those cuts.
What are dimensions in a chart of accounts?
Dimensions separate what a transaction is (the account, e.g. transport) from where or why it occurred (branch, project, department). This lets one account be sliced many ways without creating a separate account for every combination, keeping the chart clean while making reporting far richer than older account-code-only systems allowed.