
ABC Analysis: Focusing Stock Control Where It Pays
Not every item on your shelves deserves the same attention. ABC analysis sorts stock by the value it ties up so you guard the few items that matter most and stop wasting control on the many that do not.
Most stockrooms are managed as if every item were equally important — the same counting frequency, the same reorder attention, the same worry — when in reality a small handful of items ties up most of the money and a long tail ties up almost none. ABC analysis is the discipline of admitting that and acting on it. It ranks every item by its annual consumption value and sorts the list into three classes, so your tightest control lands where the money actually is.
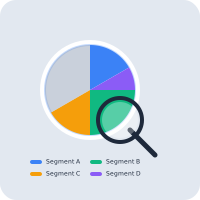
The three classes
The classic pattern follows the Pareto principle — roughly 80% of value sits in about 20% of items. ABC analysis formalizes that into three tiers by annual value (unit cost × annual usage):
| Class | Typical share of items | Typical share of value | How to manage it |
|---|---|---|---|
| A | ~10–20% | ~70–80% | Tight control: frequent counts, close reorder review, never stock out |
| B | ~30% | ~15–20% | Moderate control: periodic review, sensible reorder points |
| C | ~50–60% | ~5% | Light touch: bulk orders, infrequent counts, generous buffers |
The insight is counter-intuitive at first: the C items, though most numerous, barely move the financial needle, so spending scarce management time counting them precisely is waste. The A items, though few, are where a stockout costs a sale or a mispriced count distorts the whole balance sheet — so they earn the attention.
How to run an ABC analysis
Five steps
- For each item, calculate annual consumption value = unit cost × units used per year.
- Sort every item from highest annual value to lowest.
- Add up the cumulative value down the list as a running percentage of the total.
- Draw the lines: items making up the first ~80% of value are A, the next ~15% are B, the rest are C.
- Assign each class its own counting frequency, reorder policy, and buffer level — then act on it.
The last step is the one organizations skip. Classifying items is a spreadsheet exercise; the value only appears when class A items get cycle-counted far more often than class C, when reorder attention is concentrated, and when nobody is doing a painstaking count of cheap fast-movers that could simply be reordered in bulk.
ABC is a lens, not a law
A cheap item can still be critical — a KES 50 part that halts a production line belongs in class A regardless of its consumption value. Treat the value ranking as the starting point, then override for criticality, lead-time risk, and perishability. The goal is focused attention, not blind arithmetic.

ABC analysis also sharpens every other inventory decision. It tells you where to invest in tighter reorder points and safety stock, which items justify the effort of an EOQ calculation, and where your inventory turnover problems are actually concentrated. When your item catalogue carries a live consumption value, the classification is a report rather than a project — and it can be refreshed the moment demand patterns shift.
What AWRA OpsHub does today
- An ABC class and a velocity class on a count plan, so a cycle-count programme can target class A items on a tighter rhythm than class C — which is the single highest-value use of the classification.
- Risk level on a count plan alongside those, for the cheap-but-critical items the pure value ranking misses.
- Inventory valuation and stock movement reports with the underlying figures — cost, quantity, movement — that the ranking is built from.
- Dead stock and aging, which is usually where your C-class problem actually shows up.
- An ABC Analysis report — shipped 2026-08-01. Items ranked by consumption value over any period and banded A/B/C on cumulative share of value, so the A band is "the items making up the first 80% of spend" rather than an arbitrary top 20% of rows. Both cut-offs are adjustable, consumption covers stock issues and till sales, and an item that consumed nothing is forced to C rather than floating up on a rounding artefact. Exports to CSV and PDF.
More we can add to your workspace
- The class written back to the item. The report ranks and bands today, and the class on a count plan is a value you set by hand — carrying it across automatically is the build.
- A reclassification schedule. A prompt when an item drifts from C to A, instead of a report you remember to re-run.
- Multi-criteria banding. Ranking is by consumption value only. The cheap-but-critical item still needs the separate risk level on the count plan.
Until 2026-08-01 the ranking was entirely yours to build in a spreadsheet. It is now a report. The remaining manual step is the one that matters least and costs least: reading the A list and setting the class on your count plan, which is where the classification actually changes behaviour.
Anything above that you need, we can build for you
Everything listed above as something we can add describes what ships in the standard product today — it is a starting point, not a limit on what AWRA OpsHub can do for your organisation. Kenya's eTIMS integration and its maintained payroll engine are both in the product because clients needed them and commissioned them; neither appeared by itself, and the same door is open for whatever you just read about. One qualification so this is worth what it claims: a small number of things on this blog we deliberately leave to a specialist rather than build — a statutory ledger we will not sign our name to, a rule that would decide a tax question for you, a clinical or member-funds record that belongs in a regulated system — and where that is true the post says so in those words. Everything else is a scope, a timeline and a price.
The operational work, which is what most commissions actually are
An extra approval stage in a chain that does not match the standard one, a custom field set on employees or assets that only your sector needs, an expiry that has to block an order rather than send an email, a report your board asks for in a shape nothing produces, or a scanner or weighbridge feeding the goods-in door. These are the commissions we are asked for most often and the smallest ones we quote — and unlike a revenue-authority pipeline, none of them waits on a regulator.
The module-shaped additions, which are the ones readers ask for most often
A price list with real discount authority, a customer-facing quotation that expires, a bill of materials or recipe costing, a staff advance that is issued, acquitted and chased, a member or unit ledger, a matching rule that holds a payment. Each of these is a build rather than a setting, and each has been quoted before — a bigger piece of work than a custom field, with a written spec and a date instead of a roadmap slide.
The report, document or pack nothing currently produces
The board pack in the shape your board actually asks for, a donor or funder layout, an invoice or receipt template carrying what your regulator or your customer expects, a dataset the report builder cannot reach yet. Usually the fastest thing on this list to deliver, because the data is already in the system.
Systems, rails and hardware you already run
The accounting package, CRM, online store, core banking or custom database you intend to keep — connected through our API so a fact is entered once and appears everywhere it is needed. Plus the physical edge: a scanner, a scale, a weighbridge or a till peripheral feeding the door it belongs to.
How it works: you describe the requirement, we return a written scope, timeline and cost, and once agreed it is built into your environment and maintained as part of the product. Nothing here waits on a regulator or a published specification, which is why operational builds are the ones we quote fastest. Tell us the requirement that would otherwise rule us out — that is a better first conversation than a demo.
Tell us what your operation needsClassification decides where to spend attention; stock control in Kenya covers what to actually do with the attention once it is aimed correctly.
Count where the money is
Cycle-count plans that target items by ABC class, velocity and risk level — so your counting effort follows the value.
See inventory countsFrequently asked questions
What is ABC analysis in inventory management?
It is a method of classifying stock items into three groups by their annual consumption value — A (few items, most value), B (moderate), and C (many items, little value) — so that management effort, counting frequency, and reorder attention are concentrated on the items that tie up the most money.
How do I calculate which class an item belongs to?
Multiply each item's unit cost by its annual usage to get its consumption value, sort all items from highest to lowest, then take the cumulative percentage of total value: the first ~80% are class A, the next ~15% class B, and the remaining ~5% class C. Adjust the exact cut-offs to fit your catalogue.
Should cheap items always be class C?
Not necessarily. ABC ranks by value, but a low-value item that is critical — one whose stockout halts production or a service — should be promoted to tighter control regardless. Use the value ranking as the default and override for criticality, long lead times, and perishability.
How often should ABC classifications be refreshed?
At least annually, and more often if demand is volatile. Items migrate between classes as consumption patterns change, so a classification that is never revisited slowly stops matching reality. With live consumption data, refreshing it is a report rather than a manual project.